Airspace Digital Twin
A living model of airspace.
A living state that remembers how it came to be what it is now.
Evidence levelE1Architecture Defined
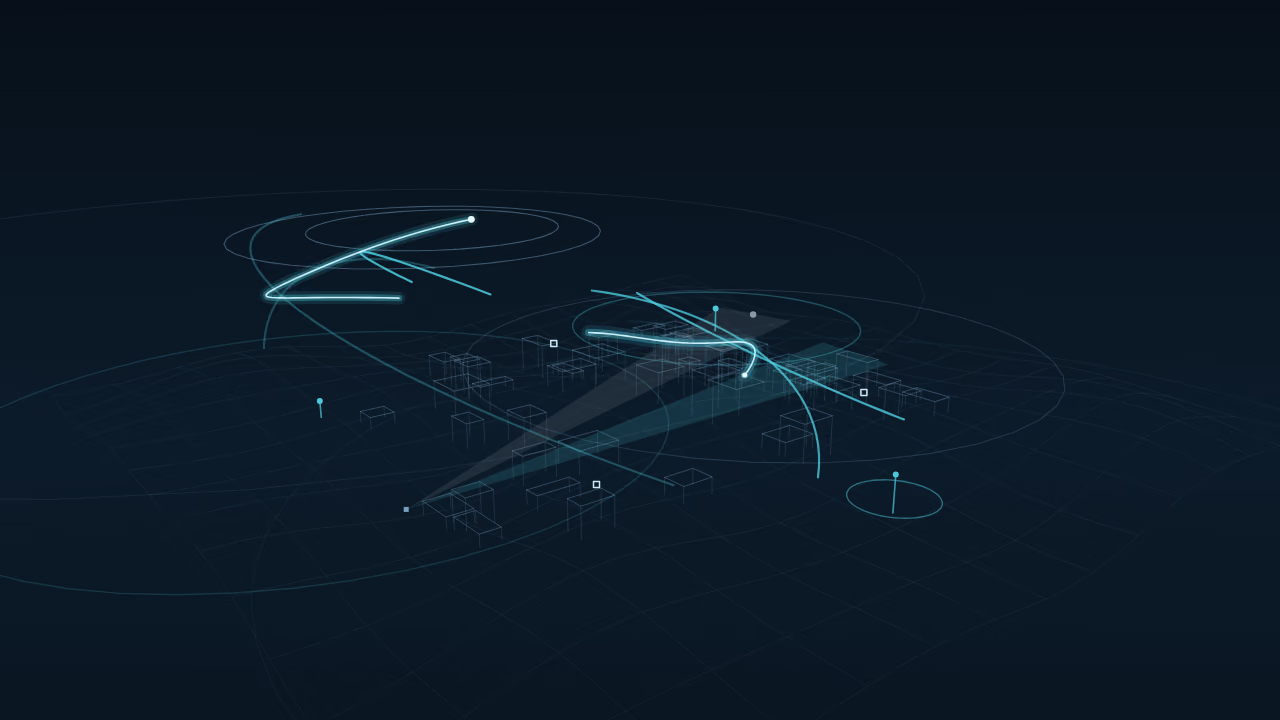
Your device shows a still view. The layers and the replay below carry the same meaning.
A living state, not a 3D map.
The twin is the model the platform keeps of the airspace. The scene is only one way to look at it; the state underneath is what matters.
- Live stateWhat the platform holds now, with the age of every part.
- HistoryEvery earlier state stays, so a decision can be reviewed against what was known.
- ContextTerrain, weather and the surroundings that change how an observation reads.
- Confidence and evidenceHow sure the platform is, and what that rests on, kept as two different things.
Ten layers of one state.
Switch layers in the scene above or read each one here. A layer is a way of looking, not a separate system.
- TW01Base environmentTerrain and built form, generalised so no real site is shown.
- TW02Observations and sourcesWhere each source stands and what it has just seen.
- TW03Tracks and unified stateOne track per object, drawn from the linked observations.
- TW04Classification and contextThe class when there is one, and grey when there is not.
- TW05ConfidenceA sheath around each track whose width is the confidence band.
- TW06Evidence and provenanceThe drawer that shows what a state rests on.
- TW07Environmental contextConditions that change how far an observation can be trusted.
- TW08System healthWhether each source is available, delayed or silent.
- TW09History and replayThe time slider and the stored states behind it.
- TW10Network and integrationHow this site joins the wider network and the outputs.
Known then is not known now.
The twin stores each state as it was known at the time. Review can add what was learned later, but it never rewrites the earlier state.
- First observation
- Second source joins
- Gap
- State updated
- Rest state
| Time (relative) | Value |
|---|---|
| 6 | First observation |
| 28 | Second source joins |
| 50 | Gap |
| 72 | State updated |
| 94 | Rest state |
Replay a synthetic scenario.
Step through five moments of a fixed scenario and see which evidence was kept at each. The link below leads to the full replay capability.
Step 1 of 4Step 1
Three questions the twin answers.
How confidence changed, how the environment changed the reading, and how the state depends on the health of the system.
- Confidence
- Uncertainty band
| Time (relative) | Confidence | Uncertainty band |
|---|---|---|
| 1 | 40 | 26 - 54 |
| 2 | 42 | 28 - 56 |
| 3 | 45 | 33 - 57 |
| 4 | 60 | 52 - 68 |
| 5 | 63 | 56 - 70 |
| 6 | 66 | 60 - 72 |
| 7 | 68 | 62 - 74 |
| 8 | 52 | 40 - 64 |
| 9 | 50 | 38 - 62 |
| 10 | 54 | 44 - 64 |
| 11 | 58 | 49 - 67 |
| 12 | 60 | 52 - 68 |
| Time (relative) | Wind | Visibility | Temperature |
|---|---|---|---|
| 1 | 12 | 60 | 8 |
| 2 | 14 | 58 | 9 |
| 3 | 18 | 52 | 11 |
| 4 | 22 | 40 | 14 |
| 5 | 20 | 36 | 17 |
| 6 | 16 | 42 | 18 |
| 7 | 14 | 50 | 17 |
| 8 | 13 | 56 | 15 |
| 9 | 15 | 60 | 12 |
| 10 | 17 | 62 | 10 |
- Normal
- Degraded
- Unavailable
| Time (relative) | Component 1 | Component 2 | Component 3 |
|---|---|---|---|
| 1 | Normal | Normal | Normal |
| 2 | Normal | Normal | Normal |
| 3 | Normal | Normal | Normal |
| 4 | Normal | Normal | Unavailable |
| 5 | Normal | Normal | Unavailable |
| 6 | Normal | Degraded | Normal |
| 7 | Normal | Degraded | Normal |
| 8 | Degraded | Normal | Normal |
| 9 | Degraded | Normal | Degraded |
| 10 | Normal | Normal | Normal |
| 11 | Normal | Normal | Normal |
| 12 | Normal | Normal | Normal |
Expand without losing the local picture.
A twin of one site can join others. The local context stays as the picture grows to a region.
| Stage | Value |
|---|---|
| Site | 8 |
| Local | 5 |
| District | 3 |
| Region | 1 |
What the twin does not do.
These limits apply to every view on this page.
- The scene is syntheticNo real site, sensor or result is shown. The scenario is fixed and drawn for illustration.
- Unknown is not zeroAn empty area means nothing was observed there, not that nothing is there.
- Detection is not identificationA track can exist while its class stays open, and the twin leaves it open.
- Designed to, not proven toThe twin is at an architecture-defined evidence level. It is not a statement of performance.